目前 iOS 性能工具已知只有 PerfDog 支持动态显示并存储历史性能数据。一些内存泄漏问题,需要长时间运行才能暴露出来,但随着 PerfDog 收费,长时间的进行性能测试,成本开销会比较高,这时候就急需一款替代产品。
本文主要介绍 iOS 如何搭建动态显示性能、存储数据的一种思路,安卓也可以用类似的方法实现。因为安卓实现方式较多,本文就不单独介绍。
该系统主要实现实时获取七猫免费小说阅读时的性能数据,并上传到服务端进行监控显示。该系统主要用 Airtest 实现七猫免费小说自动翻页,模拟用户真实使用阅读进行翻页场景。通过 tidevice 获取到实时性能数据后上传到服务器。通过 Prometheus 进行数据存储。最终通过 Grafana 展示七猫免费小说的性能数据。并做到实时监控。
1 整体架构
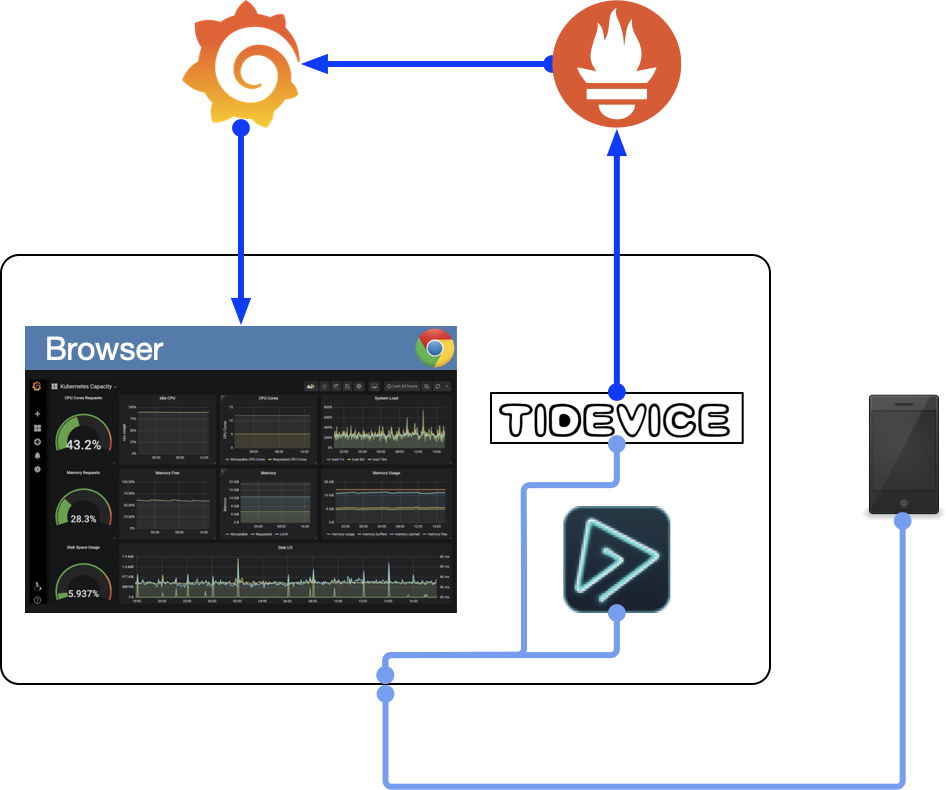
- tidevice 获取性能数据;
- AirTest 实现测试自动化;
- Prometheus 进行数据存储;
- Grafana 展示数据;
2 环境搭建
2.1 Prometheus 和 Grafana
Prometheus 是一个简单的开源的时序数据库,即按相同时序,以时间维度存储连续的数据的集合,适合存储设备的性能、日志等带时间戳的数据。当然这里也可以使用 InfluxDB,或者 VictorialMetrics 等等。
Grafana 是一个完全开源的度量分析与可视化平台,可对来自各种各种数据源的数据进行查询、分析、可视化处理以及配置告警。
2.1.1 镜像
一般来说,Prometheus 以收集数据的方式来运行,这里为了方便,使用 Prometheus 的 remote-write-receiver 方式来运行,打开该功能需要修改 Prometheus 的启动参数,所以需要重新制作镜像。
创建 Dockerfile 文件,并输入以下内容:
FROM bitnami/prometheus:latest

CMD [ "--config.file=/opt/bitnami/prometheus/conf/prometheus.yml", "--storage.tsdb.path=/opt/bitnami/prometheus/data", "--web.console.libraries=/opt/bitnami/prometheus/conf/console_libraries", "--web.console.templates=/opt/bitnami/prometheus/conf/consoles", "--enable-feature=remote-write-receiver" ]
然后在命令行中执行:
docker build --rm --file Dockerfile -t shuashuaxing/prometheus-remote-write-receiver .
docker push shuashuaxing/prometheus-remote-write-receiver
如果有需要,可以把镜像推送到线上的镜像仓库中。
2.1.2 部署
这里直接使用 docker-compose 方式来部署,避免复杂的安装过程。
Docker是Docker.Lnc公司开源的一个基于LXC技术之上搭建的Container容器引擎,源代码托管在Github上,基于Go语言并遵从Apache2.0协议开源。Docker属于Linux容器的一种封装,提供简单易用的容器使用接口。Docker将应用程序与该程序的依赖,打包在一个文件里面。运行这个文件,就会生成一个虚拟容器。程序在这个虚拟容器里运行,就好像在真实的物理机上运行一样。有了Docker,就不用担心环境问题。
总体来说,Docker的接口相当简单,用户可以方便地创建和使用容器,把自己的应用放入容器。容器还可以进行版本管理、复制、分享、修改,就像管理普通的代码一样。具体使用方式可以参考Docker官网:https://docs.docker.com/
首先,创建 docker-compose.yml 文件,放在 perf 文件夹下,内容如下:
version: '3.1'
services:
  prometheus:
    image: shuashuaxing/prometheus-remote-write-receiver
    container_name: prometheus
    ports:
      - 9090:9090
    restart: always
  grafana:
    image: bitnami/grafana
    container_name: grafana
    ports:
      - 3000:3000
    restart: always
然后,在命令行窗口执行以下命令:
# 1. 进到 yaml 文件所在的 perf 文件夹,启动容器;
docker-compose up -d

# 2. 查看启动的镜像;
docker ps -a
注意: 这里主要为演示使用,实际生产环境需要进行各种参数的配置,以在可用性、安全性、性能上有比较高的保障。另外数据没有挂载到单独的 volume 中,如果重启服务,之前的配置和数据会丢失。
2.1.3 Grafana 配置
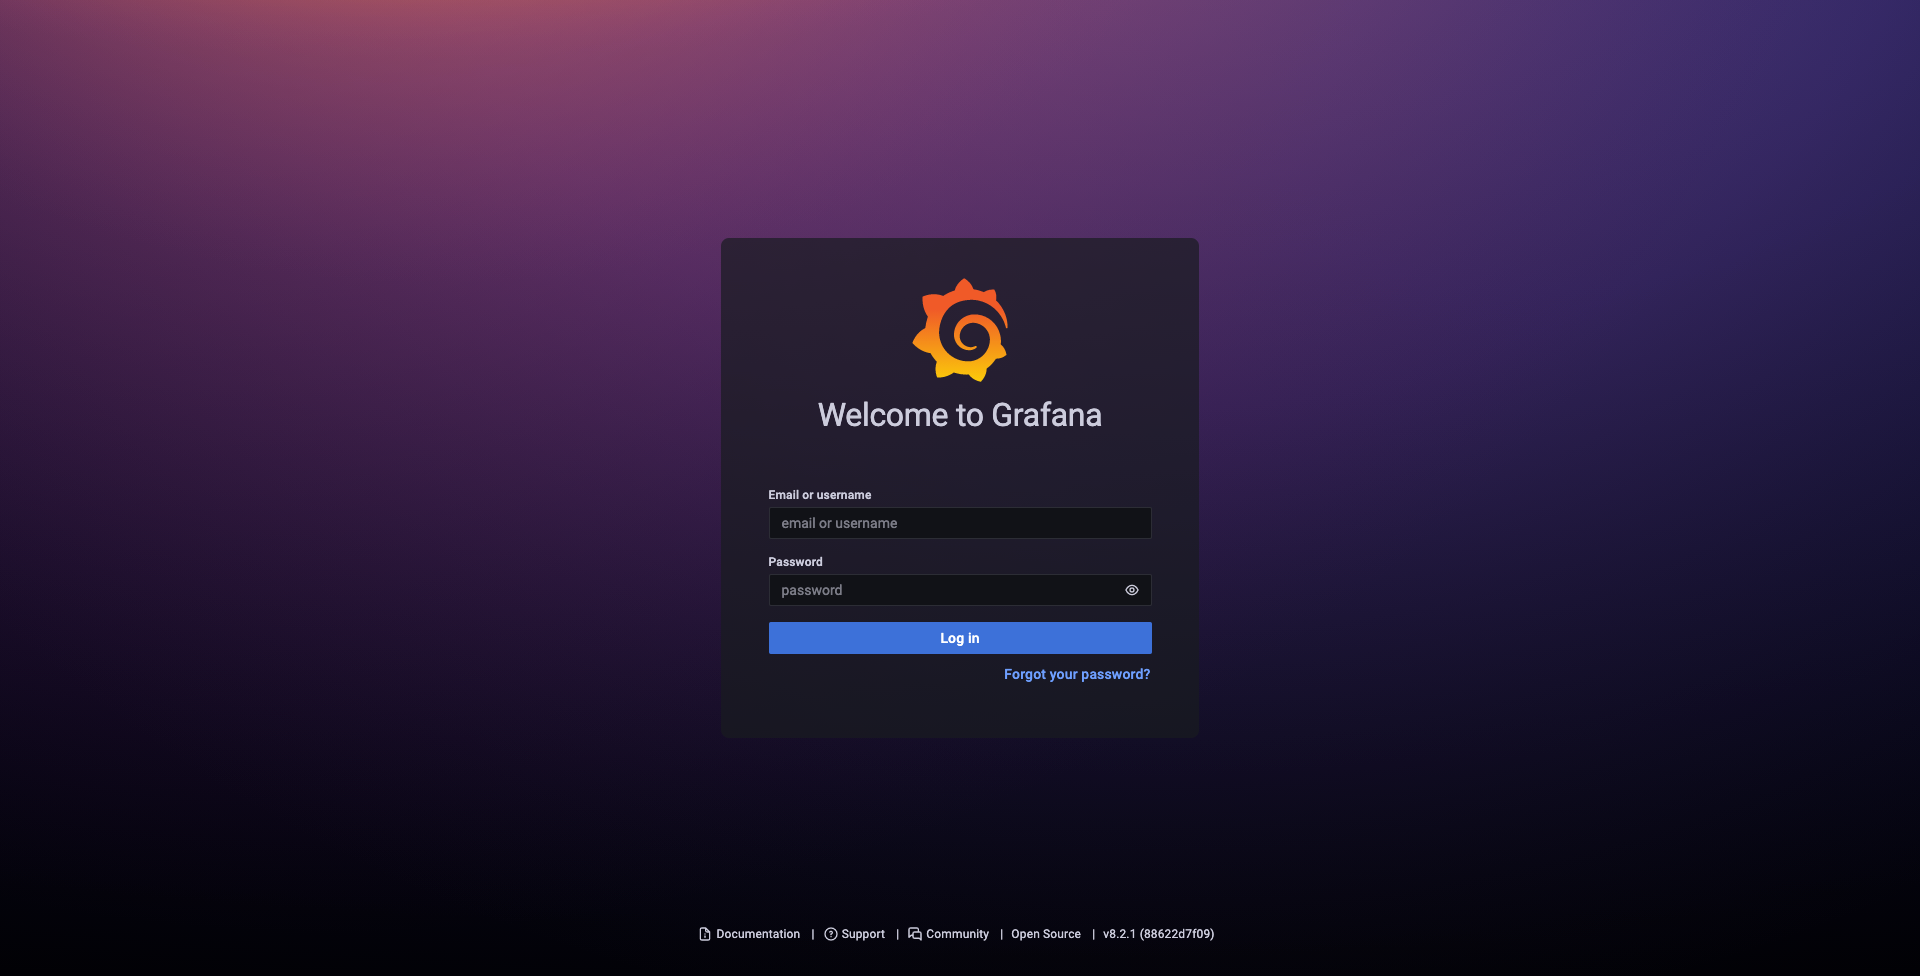
在浏览器中,输入 http://127.0.0.1:3000 打开 Grafana 页面,输入默认用户名密码 admin/admin 进入到系统中。
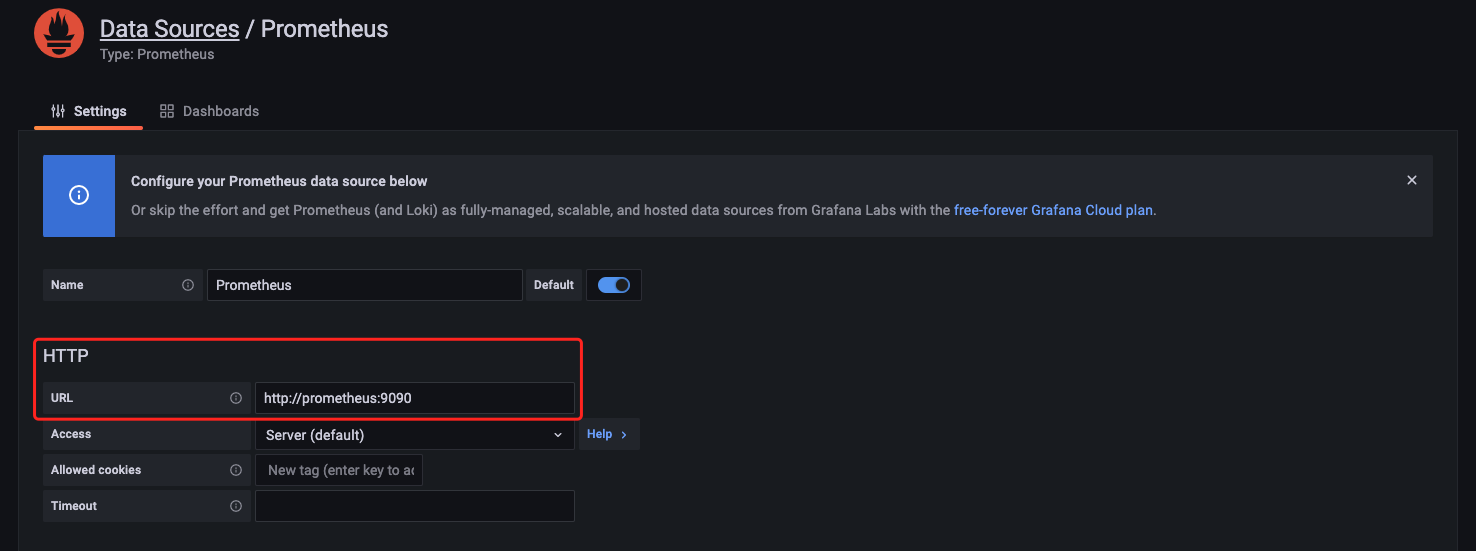
在设置中,选择数据源配置后,选择添加 Prometheus 数据源。
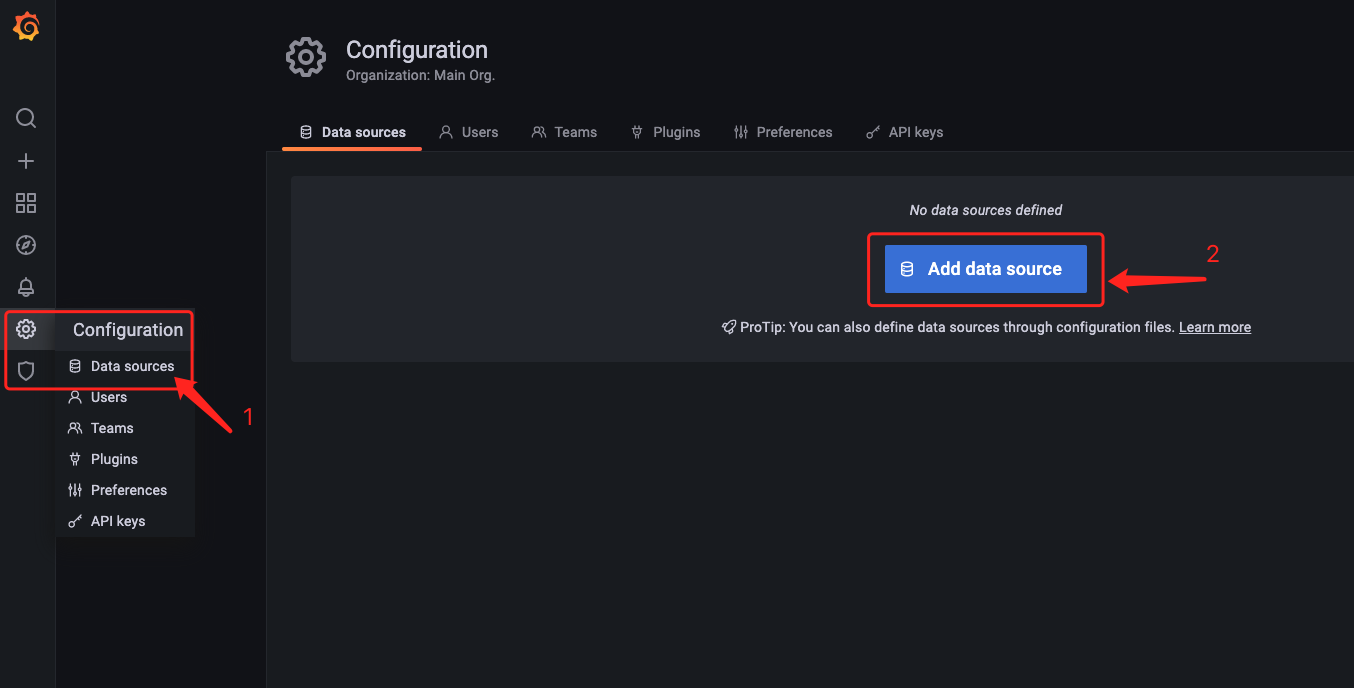
配置中填写 Prometheus 的 URL,点击保存测试即可。
2.2 数据获取
这里手机性能数据获取使用 tidevice(taobao-iphone-device),是阿里的内部的一个小组用来做 iOS 自动化用的工具。
2.2.1 安装
在 python 3.6 以上版本安装以下依赖库:
# 1. tidevice 获取手机性能数据;
pip3 install -U "tidevice[openssl]"

# 2. click 进行脚本基本交互;
pip3 install click

# 3. 安装 protocolbuffer;
brew install protobuf

# 4. 安装上报需要的压缩库和 http 请求库;
pip3 install python-snappy requests protobuf
2.2.2 数据获取及上报
这里上报 Prometheus 使用 ProtocolBuffer 方式,所以先准备 ProtocolBuffer 的协议文件:prometheus.proto。
syntax = "proto3";


package statistics;


message Label {
  string name  = 1;
  string value = 2;
}

message Labels {
  repeated Label labels = 1;
}

message Sample {
  double value    = 1;
  int64 timestamp = 2;
}

message TimeSeries {
  repeated Label labels   = 1;
  repeated Sample samples = 2;
}

message WriteRequest {
  repeated TimeSeries timeseries = 1;
}
然后在命令行,使用以下命令生成 python 文件:
protoc -I=. --python_out=. prometheus.proto
对应生成的文件名为 prometheus_pb2.py,在后面需要使用该文件,生成 ProtocolBuffer 的协议内容。
下面是获取数据并上报的 python 代码。
import time
import click
import snappy
import requests
import tidevice
from tidevice._perf import DataType

import prometheus_pb2


class PrometheusHelper(object):
    def __init__(self):
        self.__url = 'http://127.0.0.1:9090/api/v1/write'
        self.__write_request = None

    def append_item(self, table, value=0.0, ts=0, **kwargs):
        ts = ts or int(time.time()) * 1000
        if self.__write_request is None:
            self.__write_request = prometheus_pb2.WriteRequest()
        series = self.__write_request.timeseries.add()

        label = series.labels.add()
        label.name = '__name__'
        label.value = table

        labels = dict(kwargs)
        for label_name, label_value in labels.items():
            label = series.labels.add()
            label.name = label_name
            label.value = label_value

        sample = series.samples.add()
        sample.value = value
        sample.timestamp = ts

    def report(self):
        if self.__write_request is None:
            return False

        uncompressed = self.__write_request.SerializeToString()
        compressed = snappy.compress(uncompressed)
        try:
            response = requests.post(
                url=self.__url,
                headers={
                    "Content-Encoding": "snappy",
                    "Content-Type": "application/x-protobuf",
                    "X-Prometheus-Remote-Write-Version": "0.1.0",
                    "User-Agent": "canary-service"
                },
                data=compressed,
                timeout=30
            )
            data_sent_status = response.status_code
        except Exception as e:
            print('Request failed, error: {}'.format(repr(e)))
            return False

        if data_sent_status >= 400:
            print('Data sent failed, code: {}, data clear'.format(data_sent_status))
            return False

        self.__write_request = None
        return True


prometheus_helper = PrometheusHelper()


def callback(_type: tidevice.DataType, value: dict):
    if _type.value == DataType.CPU:
        prometheus_helper.append_item(_type.name, value['sys_value'], value['timestamp'], type='sys')
        prometheus_helper.append_item(_type.name, value['value'], value['timestamp'], type='app')
    if _type.value == DataType.MEMORY:
        prometheus_helper.append_item(_type.name, value['value'], value['timestamp'])
    if _type.value == DataType.NETWORK:
        prometheus_helper.append_item(_type.name, value['downFlow'], value['timestamp'], type='down')
        prometheus_helper.append_item(_type.name, value['upFlow'], value['timestamp'], type='up')
    if _type.value == DataType.FPS:
        prometheus_helper.append_item(_type.name, value['value'], value['timestamp'], type='fps')
    prometheus_helper.report()


def select_device():
    from tidevice._usbmux import Usbmux

    usb = Usbmux()
    device_infos = usb.device_list()

    print('Connected device:')
    udids = []
    for device_info in device_infos:
        if 'UDID' not in device_info:
            continue
        udid = device_info['UDID']
        device = tidevice.Device(udid=udid)
        device_detail = device.device_info()
        print('\t[{}] Device udid: {}, Type: {}, Name: {}'.format(len(udids), udid, device_detail['ProductType'], device_detail['DeviceName']))
        udids.append(udid)

    selected = 0
    if len(udids) > 1:
        selected = click.prompt('Please select the device number to perf', type=int, default=selected)
        if selected < 0 or selected >= len(udids):
            return None
    return udids[selected]


def main():
    perf = None
    try:
        udid = select_device()
        if not udid:
            print('\033[1;31mError: device not exist!\033[0m')
            return

        bundle_id = click.prompt('Please input the app bundle id', type=str, default='com.apple.Preferences')
        if not bundle_id:
            print('\033[1;31mError: app not exist!\033[0m')
            return

        device = tidevice.Device(udid=udid)
        perf = tidevice.Performance(device, [DataType.CPU, DataType.MEMORY, DataType.NETWORK, DataType.FPS])
        print('Perf start ...')
        perf.start(bundle_id, callback=callback)
        time.sleep(600)
    except KeyboardInterrupt:
        if perf:
            perf.stop()
        print('Perf stop ...')
    except Exception as e:
        print('Perf failed, error: {}'.format(repr(e)))


if __name__ == "__main__":
    main()
2.3 自动化测试
这里使用 AirTest 进行自动化翻页测试。具体使用方法可以参考官网:https://airtest.readthedocs.io/zh_CN/latest/index.html
2.3.1 环境搭建
环境搭建可以参考 iOS 环境搭建。
2.3.2 执行测试
自动化测试代码如下:
from airtest.core.api import *
import time


auto_setup(__file__)
touch(Template(r"tpl1631868529891.png", record_pos=(-0.113, 0.201), resolution=(750, 1334)))
touch((429,718))
touch((429,718))
# 翻页
touch((644,1109))

print("开始时间为:{}".format(datetime.now().strftime("%Y-%m-%d %H:%M:%S")))
a = datetime.now() + timedelta(minutes=30)
print("结束时间为:{}".format(a.strftime("%Y-%m-%d %H:%M:%S")))

for i in range(180):
    time.sleep(10)
    #翻页
    touch((644, 1109))
    t = round((180 - i) / 6)
    ft = 10 * i
    print("已运行 {} 秒\n还剩下 {} 分钟".format(ft, t))
    print('------ {} ------'.format(i + 1))

print("结束时间为:{}".format(datetime.now().strftime("%Y-%m-%d %H:%M:%S")))
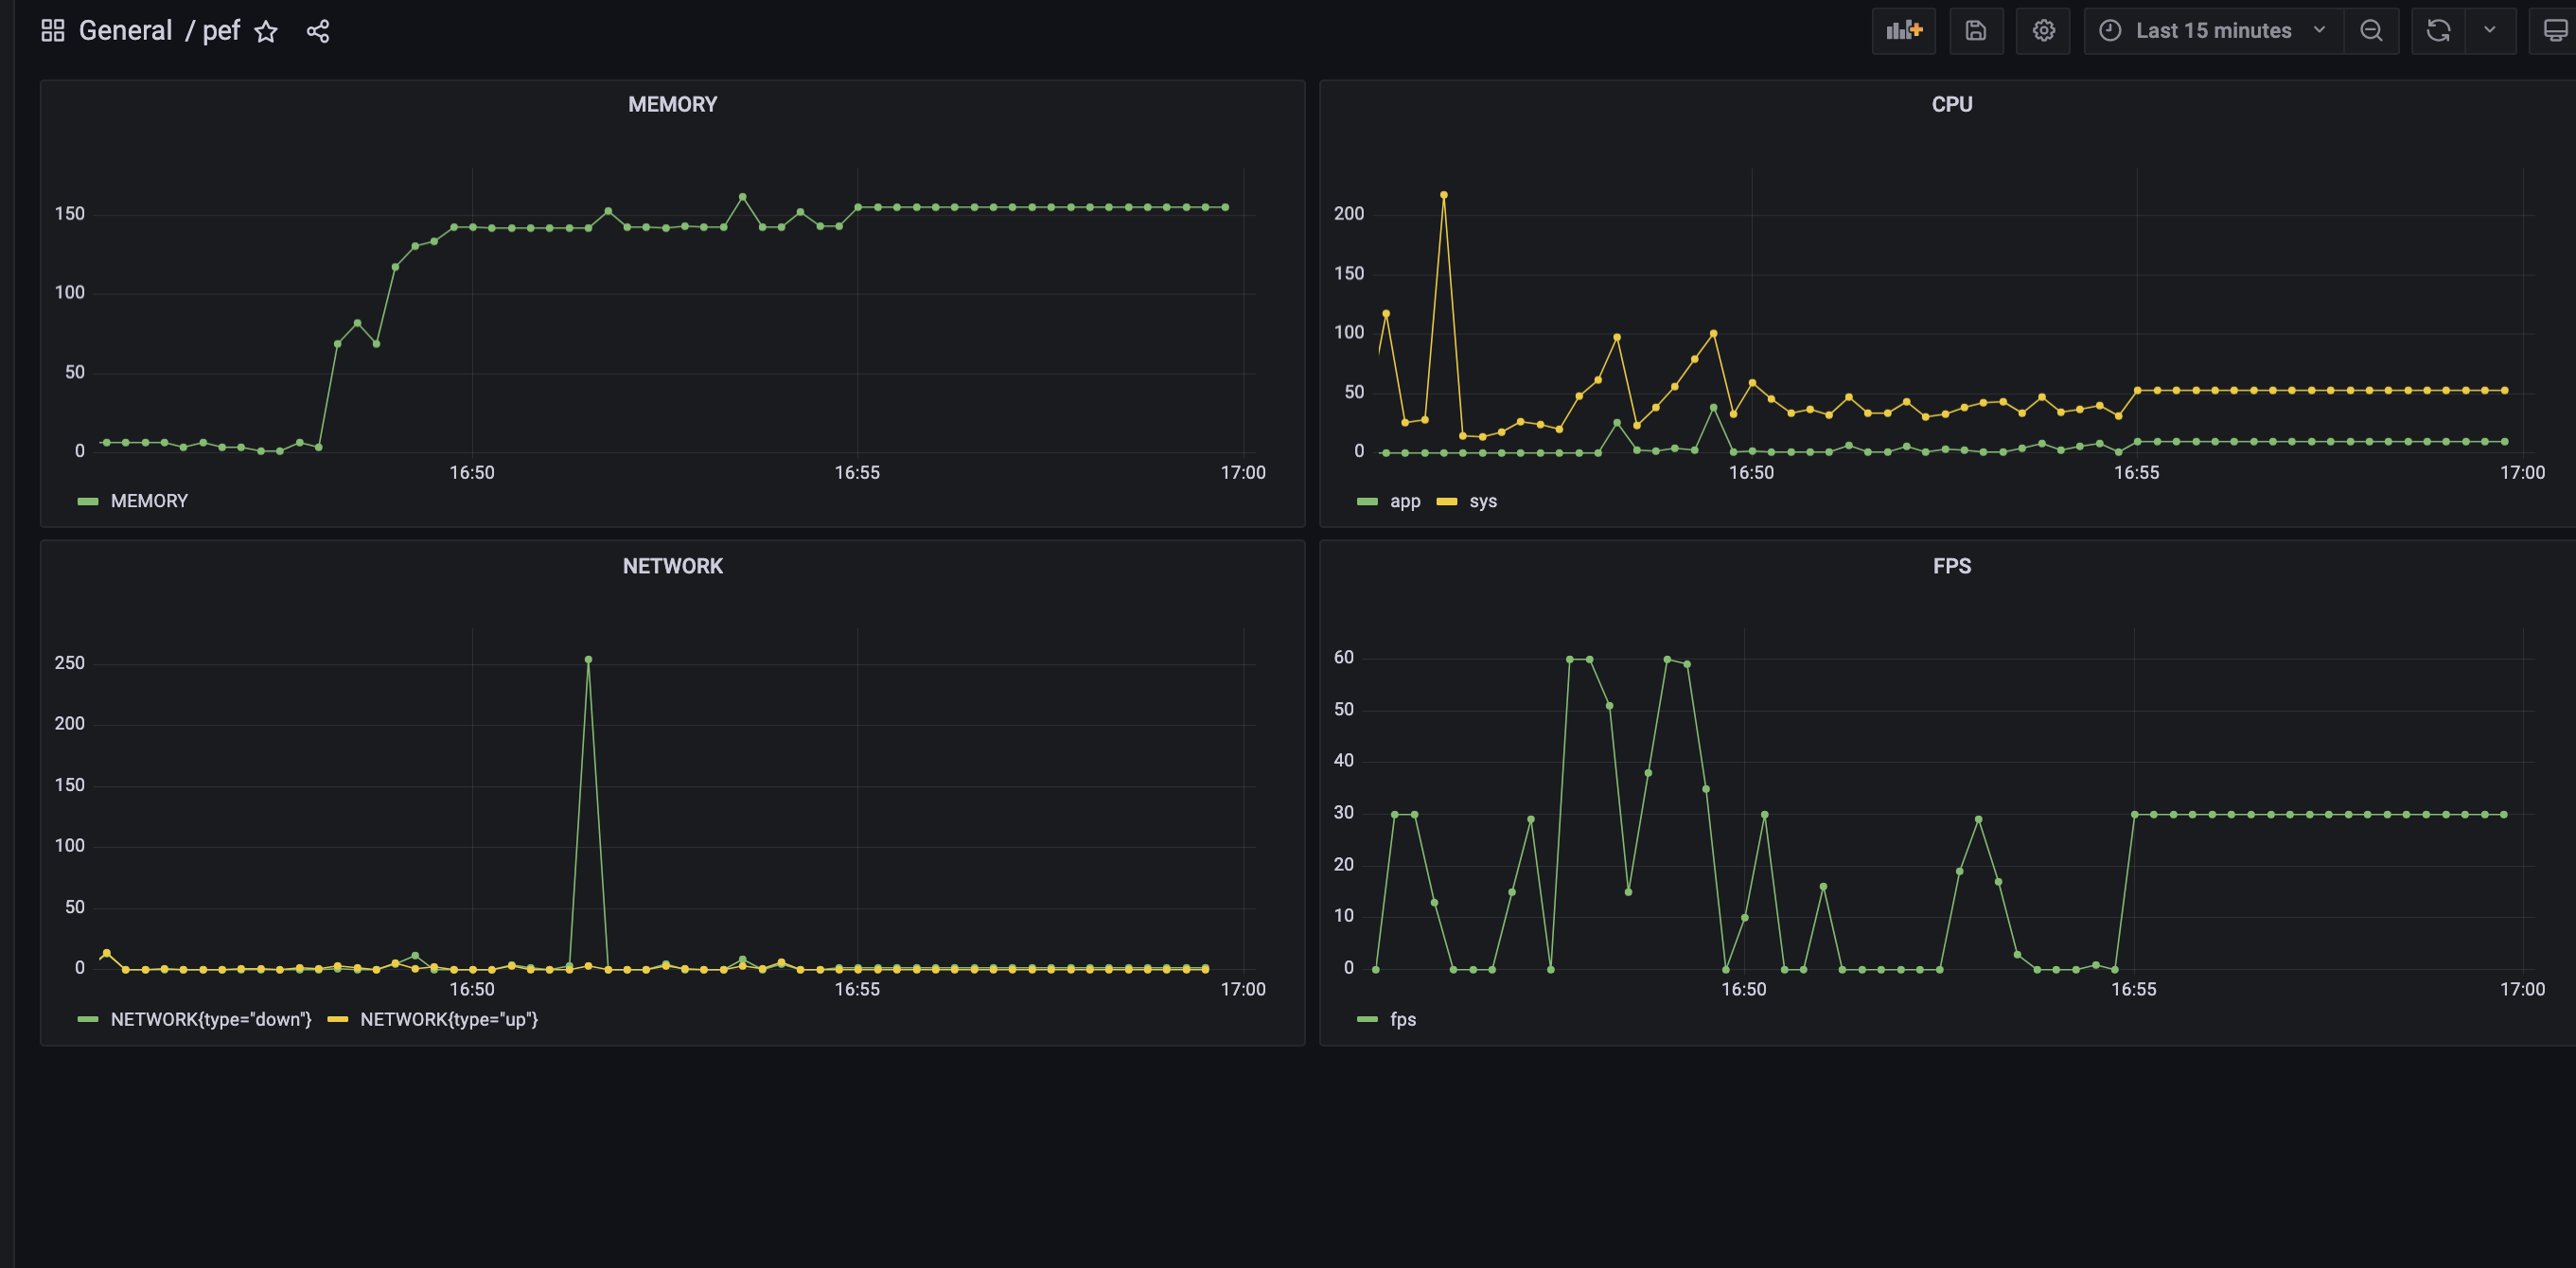
3 数据展示
3.1 创建 Panel
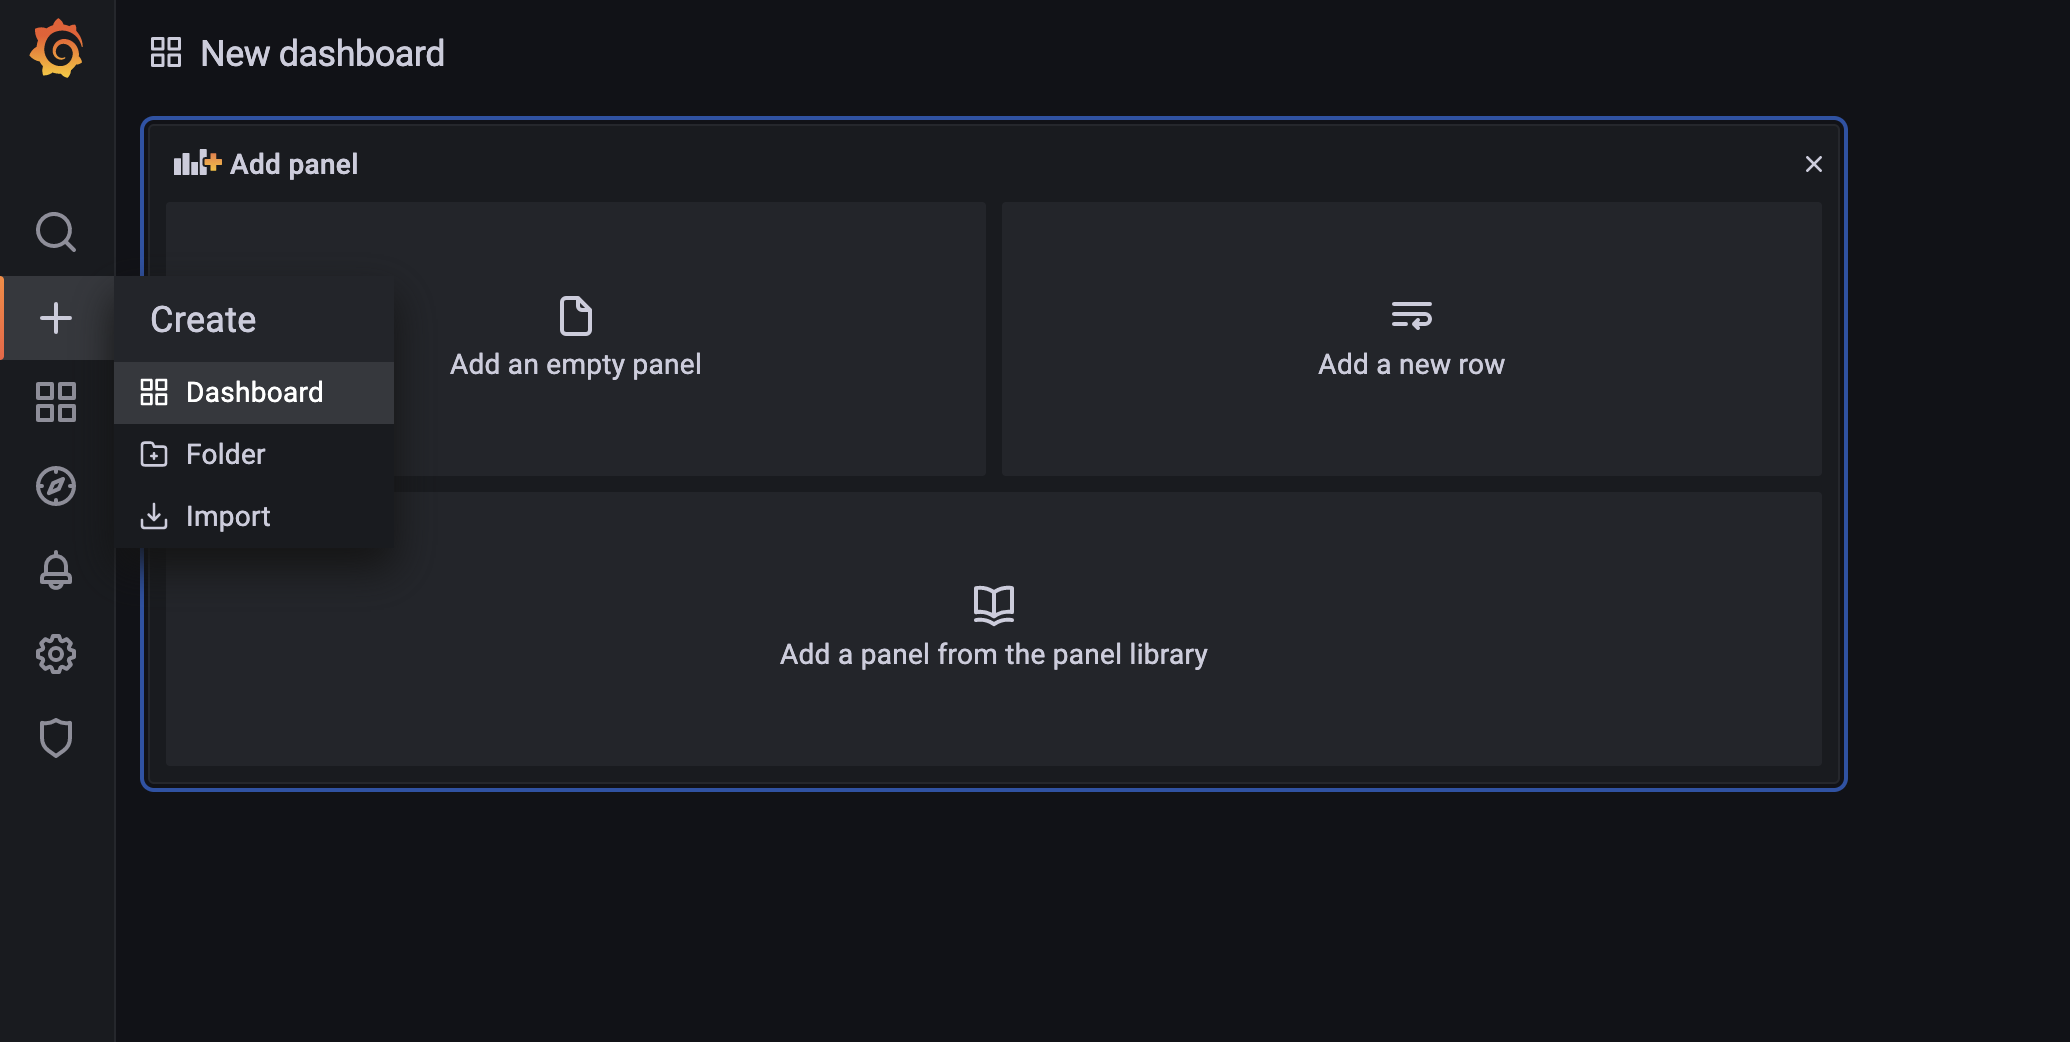
打开 Grafana,点击 Create,选择 Dashboard,之后选择添加空的 Panel。
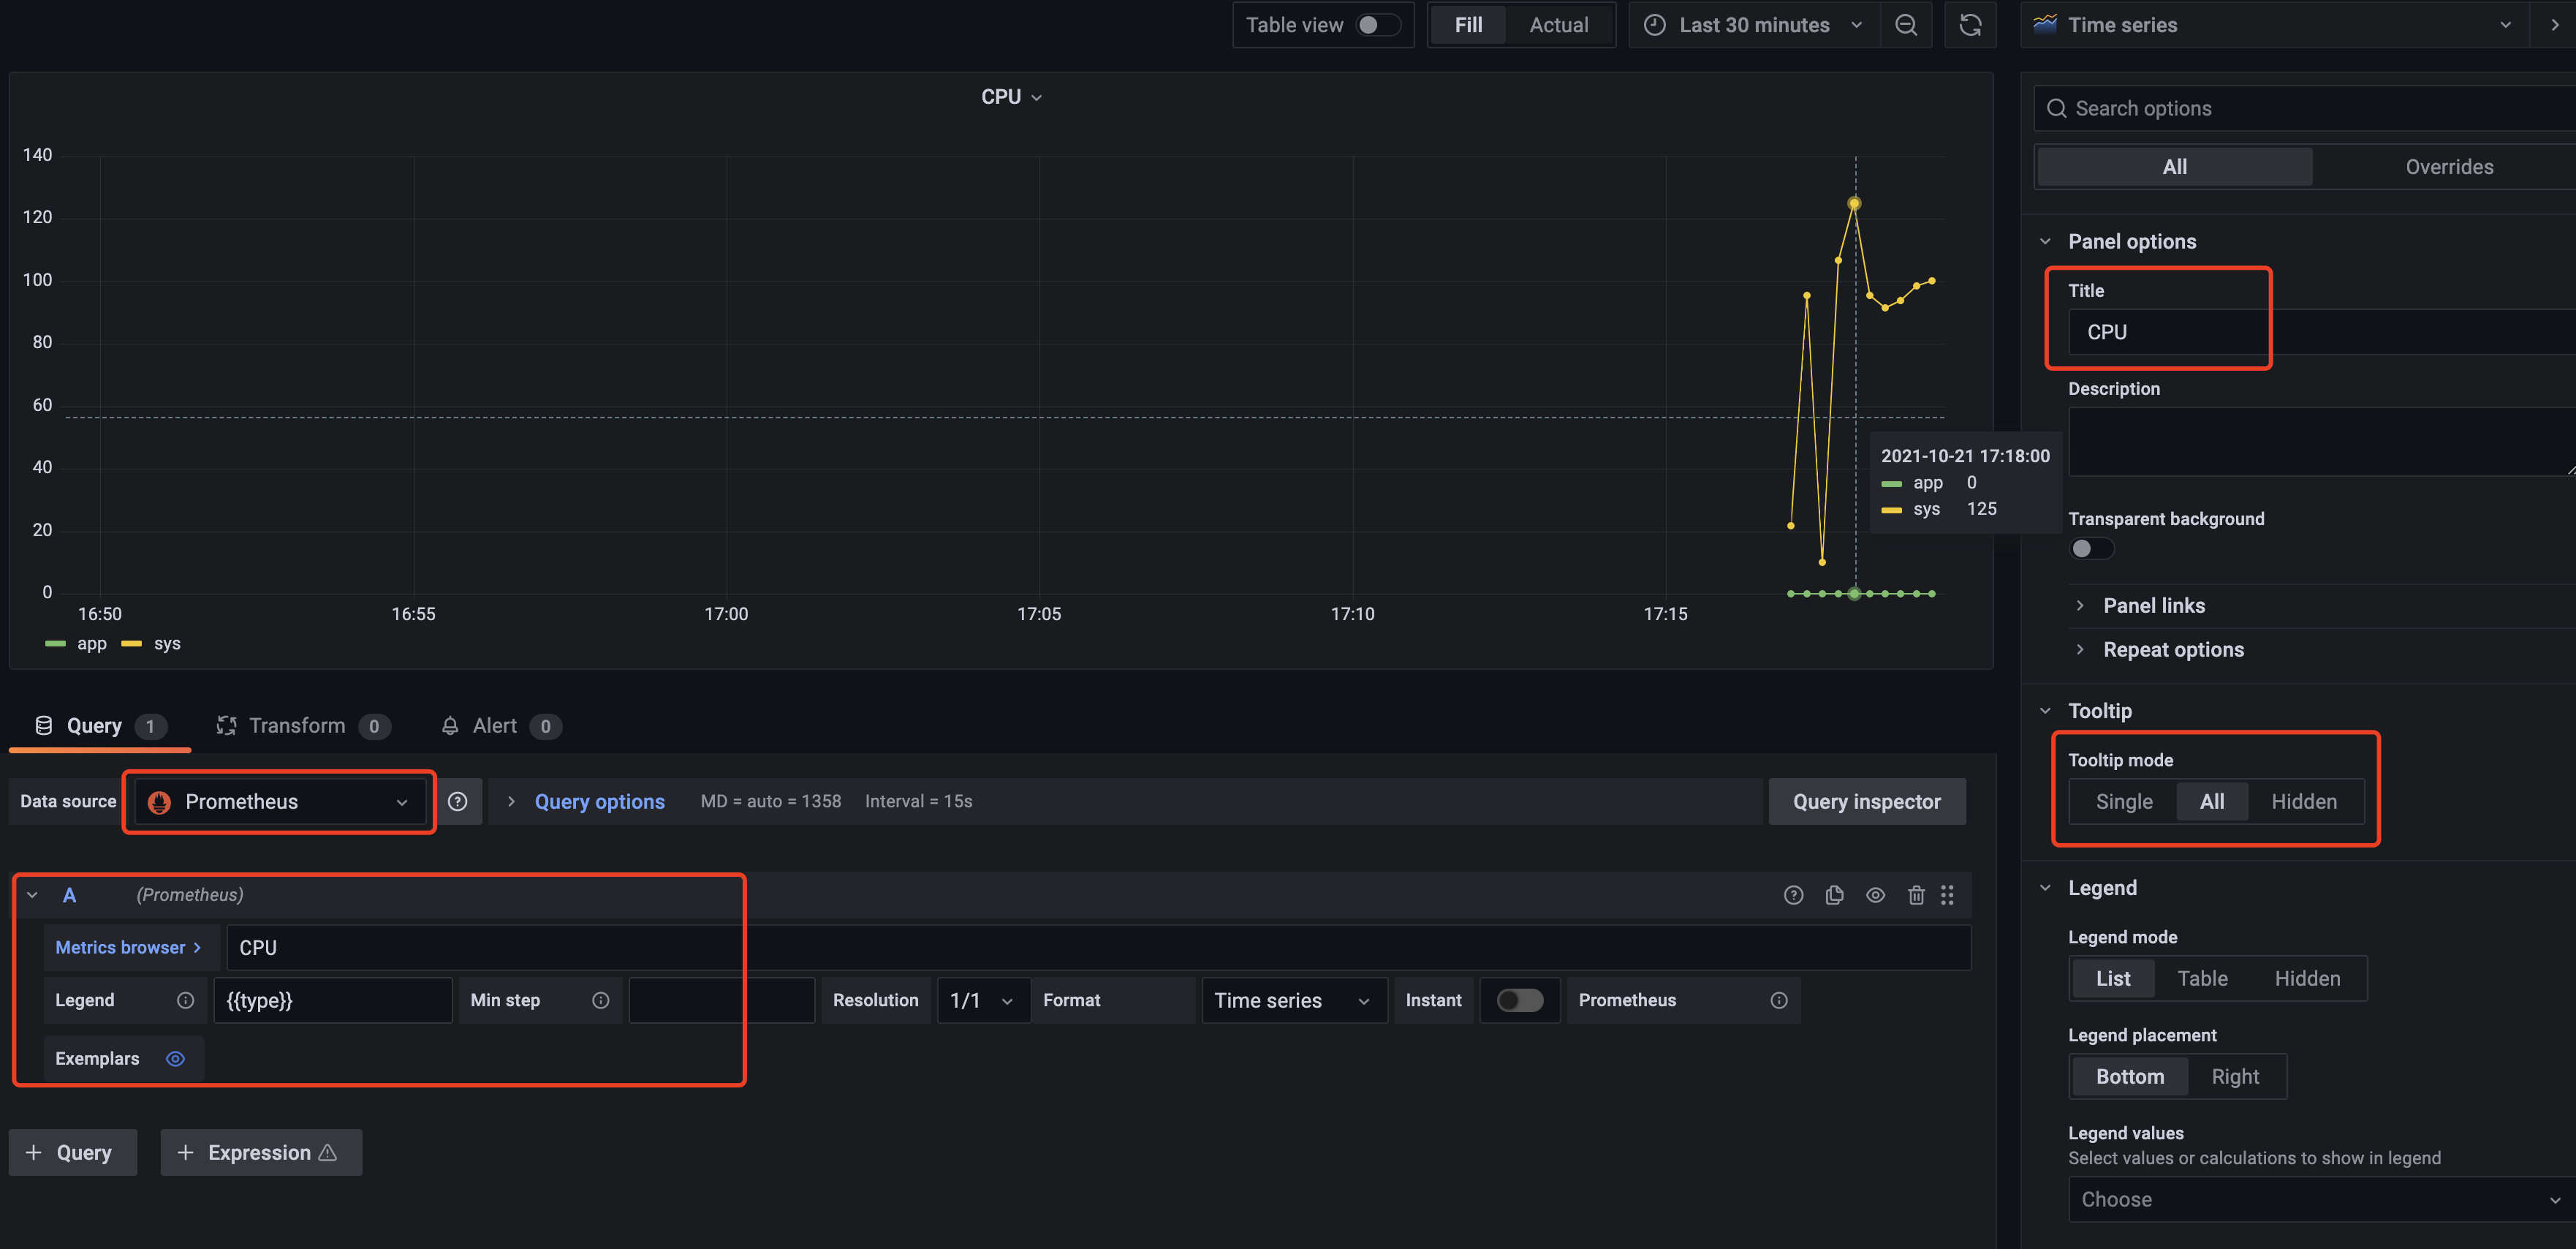
首先选择 Time series 类型的 Panel,然后在查询中,选择数据源为之前添加的 Prometheus,并在查询中输入查询语句,再根据需要修改 Panel 名称,tooltip 显示模式等等选项,最后点击 Apply 保存即可。
同样的方式添加memory、network、fps。并进行保存。
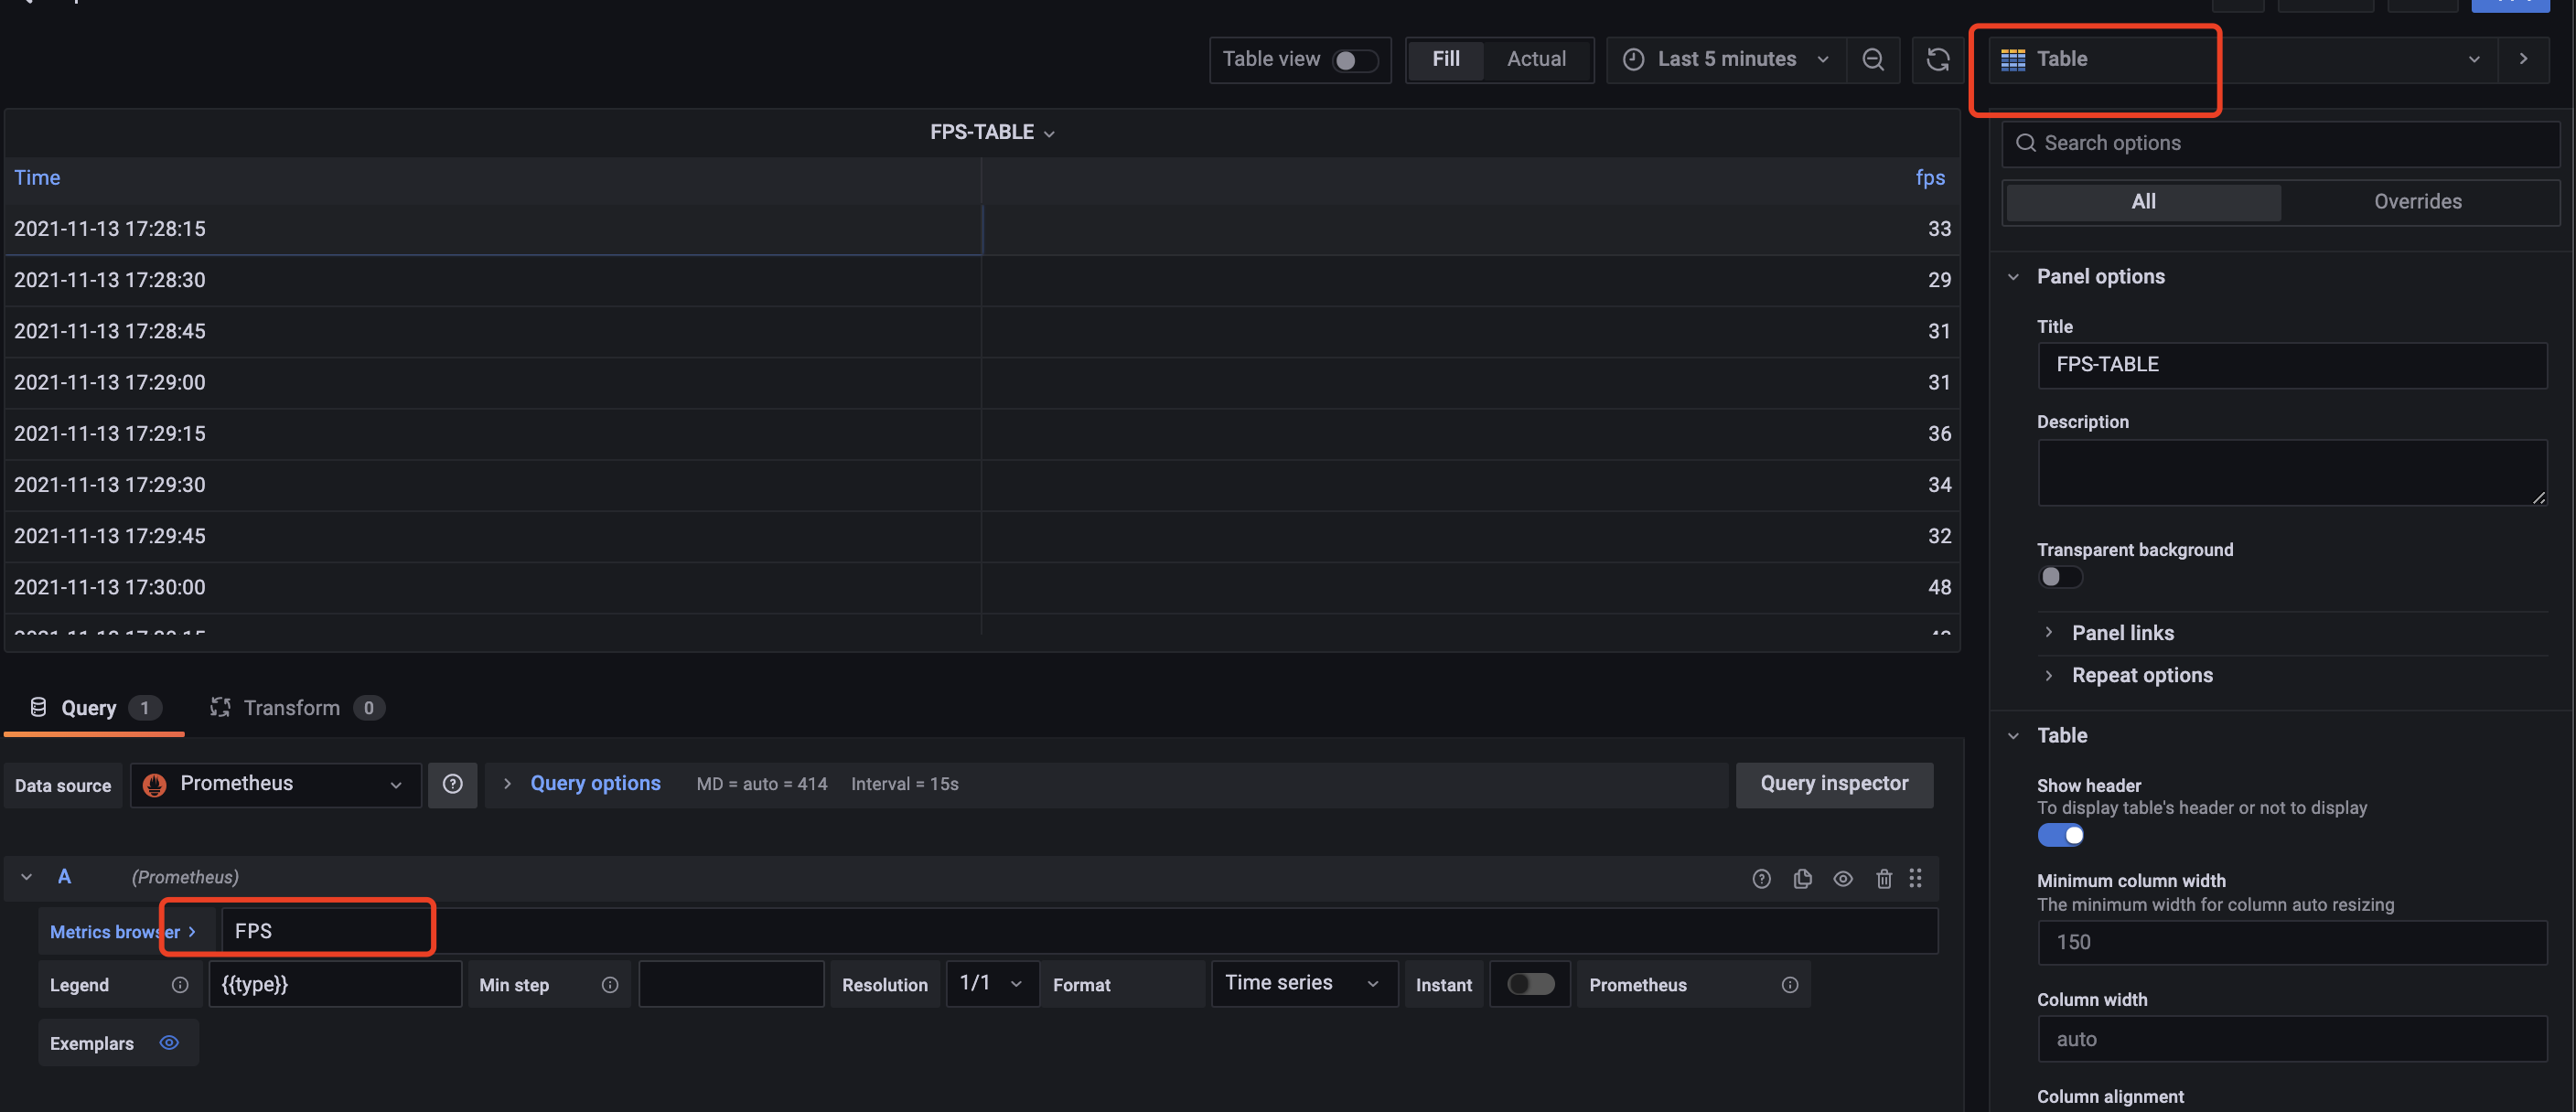
当然,也可以选择添加table形式进行显示。table展示添加方法。
3.2 查询语句
查询语句使用 PromQL 语法,可以参考 Querying Prometheus。
3.3 最后效果展示